Anatomy of the UK Charts. Part 3 - The Curse of the Drum Machine

Friday, 1 July 2011
by matthias
filed under Trends and Data
Comments: 13

This is the third part of the series, in which our Research Fellow Matthias analyses thousands of recordings from the UK singles charts using audio signal processing techniques. You can read Part 1 here and Part 2 here.

How does music change over time? Does it get faster, more complex, more diverse? In the course of the last few weeks we have learned that many aspects of music don't seem to follow that kind of simple trend. Rather, changes happen in less predictable ways. One of the most surprising examples of that emerged when we looked at the development of rhythm regularity in the UK charts...

The 80s Regularity Hump

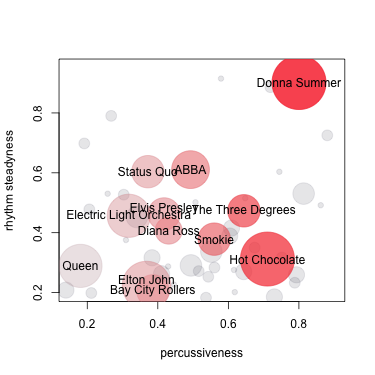
The figure below visualises data that we've already used in the first part of this series to look for disco songs: rhythmic steadiness, or "rhythm regularity", as we will call it in here. To measure rhythm regularity we have written some audio analysis code that outputs a high value if the rhythm in an MP3 file often changes between consecutive 16 second sections, and a low value if consecutive sections don't change much. Our regularity extractor is based on a mathematical description of the rhythm in every second of a track known as Fluctuation Patterns (see Further Reading, below). When we plotted rhythm regularity over the years, to our surprise we didn't find a simple trend in either direction...

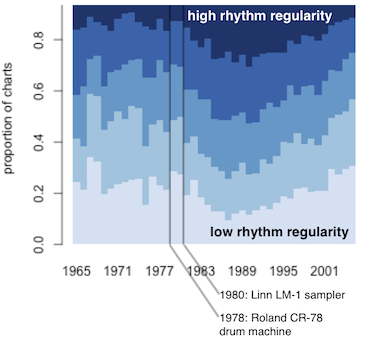
Instead, we found a regularity hump, right at the beginning of the 80s: the dark blue area shows the proportion of the charts in every year that is taken up by the most rhythmically regular tracks. Around the start of the 80s, the proportion of the most regular tracks increases noticeably, while the proportion of the most irregular ones diminishes. What could have fuelled this trend? One obvious suspect is the introduction of new technology. We have marked the release date of the first widely used drum machine, the Roland CR-78 in '78, and the first influential digital sampler, the Linn LM-1 in 1980 in the figure. We can't prove the connection but it's certainly a striking coincidence. Why does the proportion of highly regular tracks wane again in the mid 90s? Maybe people were fed up with very rhythmically regular music, or maybe drum machines simply got better at producing more diverse rhythms.

In either case, if this hump is really related to drum machines and samplers, we'd expect to see the trend in other kinds of data as well.

The 120 bpm Tempo Crunch

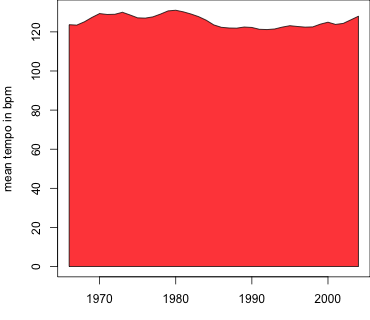
As the 80s seems to have been an unusual time for rhythm, it would be no surprise if we also saw striking things in the tempo of 80s music. We ran our tempo tracking software on the whole charts collection to measure the tempo of each section of each track in beats per minute (bpm). We then picked a single bpm value for each song by choosing the one attached to the most seconds of audio. At a first glance a plot of the average tempo per year didn't look very interesting (you can see it here). But then we noticed something unexpected. Have a look at the image below.

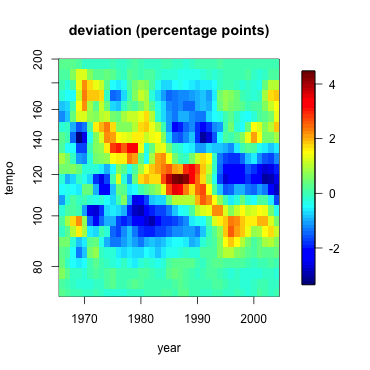
The heat map above shows you which tempos (in bpm) were unexpectedly popular in which years. For example, see the dark orange dot around tempo 100 in 1969? That means that tempos around 100bpm were more popular than usual that year (up by more than 2 percentage points). Admittedly, what's more striking is that there seems to be a downward pattern, as if some kind of music was getting slower and slower over the years. There's also a a strange cluster of tracks around 120 bpm from the early 80s to the early 90s - the big red blob in the middle.

Some tracks from the red blob:
 Prince - 1999 (120 bpm)
 Frankie Goes To Hollywood - Relax (117 bpm)
 808 State - In Yer Face (120 bpm)

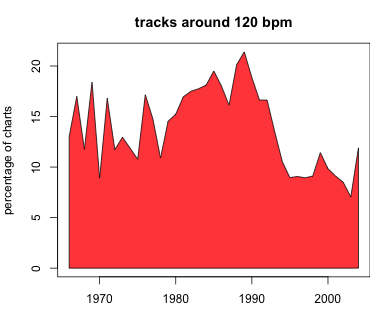
Before we ask what this cluster means, let's make sure that this trend is really there, i.e. that the proportion of tracks around 120 bpm is really higher from 1982 to 1991 than in the rest of the time. It may seem obvious from the figure below, which plots the proportion of tracks between 116 and 124bpm over time. To be really confident that this is not due to chance we use a statistical test, a "2-sample test", which can check whether the difference is significant... and it is, with 95% confidence we can say that the difference is between 5.5 and 8.1 percentage points (details).

Our first thought was that songwriters in the 80s must have turned on their drum machines, loved what they heard and wrote a song to that beat - without changing the default tempo setting of 120 bpm. I would love this to be correct, but I have a hunch that it's not, especially after having found this highly interesting manual for writing a hit single written by The KLF in 1988. They say that "the different styles in modern club records are usually clustered around certain BPM’s: 120 is the classic BPM for House music and its various variants, although it is beginning to creep up", and also, "no song with a BPM over 135 will ever have a chance of getting to Number One" because "the vast majority of regular club goers will not be able to dance to it and still look cool".

In this track the KLF follow their own advice.
 The KLF - 3 a.m. eternal (120 bpm)

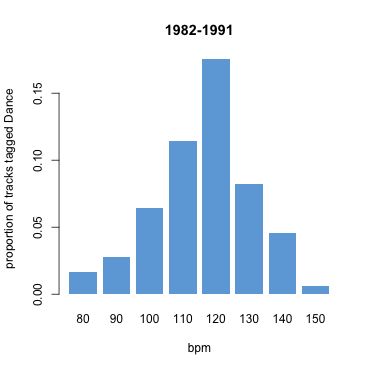
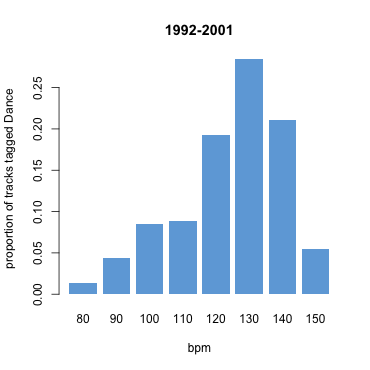
It seems that the KLF have a point. We wanted to know, and compared the tempo estimates to our Last.fm tags, especially the "Dance" tag. The figure below suggests that the KLF were really right. We took all tracks within ranges of 10 bpm (75-85, 85-95, ... , 145-155) and plotted the proportion of them that were tagged "Dance". It turns out that the KLF had quite a good grasp of what was true from 1982 to 1991. The proportion of tracks tagged as Dance is clearly highest around 120 bpm...

So was the drum machine a curse? It's been a blessing for many dancers, and it has undeniably led to the emergence of whole new genres of music, often dance music. And dancers have taken it from the club to the charts. Incidentally, somewhere along the way they must have learned to look cool even at higher bpm rates... what we see for the years 1992 to 2001 suggests a rather radical change to quicker dance music quite different from the KLF's suggestion that the tempo is "creeping up". Check the figure below.

Dance music in the 90s has clearly moved on, even the songs that did get into the charts, and its got faster. However, there seems to be another current of music that counter-balances this, as our tempo heatmap further up suggests (though it doesn't prove it).

As a reward for trying to understand all our data visualisations today we leave you with two of our new multi-tag radio stations.

Last.fm 80s + Dance Radio

Last.fm 90s + Dance Radio

Next week, bring some some earplugs, as we will try to find out where all the racket comes from in The White Noise Boys [Edit: title changed to Survival of the Flattest].

Anatomy of the UK Charts series so far

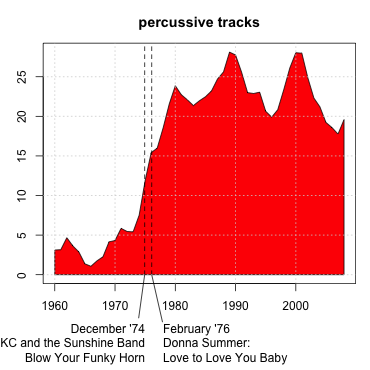
Percussiveness and the Disco Diva - on the rise of disco in the mid 70s

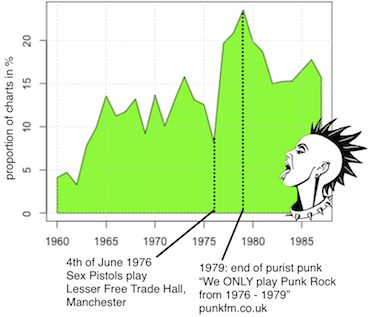
Clash of Attitudes - on automatically telling punk from art rock

The Curse of the Drum Machine - this post

Further Reading

The original article on the Fluctuation Patterns feature is by Elias Pampalk, Simon Dixon, and Gerhard Widmer: On the evaluation of perceptual similarity measures for music. In Proceedings of the Sixth International Conference on Digital Audio Effects (DAFx-03), pages 7–12, 2003.

If you want to detect the tempo of a track automatically, try Matthew Davies's tempo tracker in the Queen Mary Vamp plugin library or Simon Dixon's BeatRoot.

The Power of Sound

Wednesday, 29 June 2011
by chrissie
filed under Announcements and About Us
Comments: 2

A live music experience is such a powerful one, with each person taking moments from a gig that they will enjoy and remember for a long time to come. Some of us go back to see a favourite band or artist time and time again and somehow there is something special and different about each performance.

In the commercial team, which is where I am based, we really enjoy the challenge of pulling some of that spirit into work for relevant and interesting brands. A perfect opportunity to do this arrived with HP who are looking to explore the Power of Sound to help promote their new range of Envy laptops and the sound quality from the incorporated Beats Technology.

So, we’re blending the power of the Hype Charts and our expertise in the live arena to pull together some really special events over the new few months, and we want you to join us.

First up we’ve been on the road chatting to artists at our summer festival shows, asking them about The Power of Sound. The interviews from Liverpool Sound City can be seen here and it features artists as varied as Frank Turner, Akala and Willy Nelson. Each has their own take on the concept, and it’s great to hear each artist talk about it in their own unique and diverse way. I can’t choose a favourite from this batch but I am still amazed that the Dutch Uncles reference Bon Iver, J Dilla, Frank Zappa and Biggie Smalls all in one video!

The interviews from Get Loaded will be ready in the next few days and we’ll be at Sonisphere and SW4 amongst others for more. Keep up to date on new interviews in the radio player (UK only for these I’m afraid!) on our website and on HPUK’s Facebook page.

Next up we’ve got three pop up acoustic sets, all set up with the help of Black Cab Sessions. Our first was with Slow Club in Soho Square, and they were great. They powered on through the rain to sing a couple of songs, including a new one from forthcoming album Paradise. We’ve got pictures up on our Flickr page, and you can find footage from the set and an exclusive interview here.

All this is working towards a main gig at the end of summer… but we’re keeping details about that one secret for now. What I can say is that a team of passionate people are working on getting a great line-up as I type, and we are all set to make it a fantastic event.

As a little bonus, all of the artists that are taking part in the project will help curate an HP Power of Sound Custom Radio station, which will be ready to launch in a few days. If you want to give some input into the content of the station again please head to HP’s FB page.

And last but not least we are delighted to let you all know that we are releasing a Last.fm app for the HP Touchpad which we are sure will get a whole lot more people scrobbling!

Huge thanks to everyone involved in pulling these off. Make sure you keep an eye on our Twitter page for info about the live sets throughout the next few months, and for footage from the sessions!

Wishing you a great summer.

Anatomy of the UK Charts. Part 2 - Clash of Attitudes

Thursday, 23 June 2011
by
filed under Trends and Data
Comments: 9

As promised last week our resident Research Fellow Matthias has been hard at work data-mining our music recordings for this new instalment of our Anatomy of the UK Charts series...

Not everyone is into dancing. As I showed you in last week's post our audio analysis algorithms can trace the rise of disco after 1974, but around that same time a colourful range of other new styles emerged, including hard rock, glam and art rock... and then there was that other genre: punk, the attitude-laden antidote to "established" music.

While we haven't actually come up with a measure of attitude in music, the fact that punk was the anti-establishment, non-musician's music made it relatively easy to track down...

The Democratisaton of Making Music

"This is a chord. This is another. This is a third. Now form a band."

According to the Guardian's History of Modern Music these legendary instructions were first printed in the punk zine "Sideburns" in 1977. They are famous because they summarise the anyone-can-play attitude of early punk - the democratisation of making music. Well, if there's any truth in that, looking for harmonically simple music without fancy changes in sound colour should get us straight to punk. Will it?

We have a variety of signal processing algorithms that take an MP3 file, extract musical features from it, and then measure how much these features change over different time scales, from note to note, chord to chord, phrase to phrase or even between sections of a song. Looking at these rates of change can give us a good measure of musical complexity.

To see how complex the harmony of a song is, for example, we first extract "chroma" features. Chroma describes which notes are sounding at any time in the song. Then we look at how much the chroma changes over a time scale of around 3 seconds, which is the length that a chord is typically sustained. Using this method, lots of chord changes will lead to a high value for harmonic complexity.

Likewise for sound colour, usually called "timbre" in scientific circles, we start by computing a particular spectral feature that is heavily used in speech recognition: Mel-frequency cepstral coefficients (MFCCs). The rate of change of these MFCCs at a time scale of about a second should get us a measure of timbral complexity. If the instructions from the zine are accurate then punk shouldn't have much harmonic or timbral complexity.

In the figure below we have plotted timbre complexity against harmonic complexity. The grey dots show the positions of all songs in our charts database from 1975 to 1980, and we have overlayed some colourful stars, each representing an artist with more than 5 hits. We selected the six least and the six most "complex" artists as ranked by the sum of the squares of our two complexity measures. The centre-point of each star is the median average of the artist's songs. You can select your favourite combination of artists from the list below. The play buttons start playback of the track that's "most typical" of the corresponding artist, i.e. that which is closest to the centre of the star.

No Future!


Let them eat cake!


We find it fascinating that - as we would expect - all the famous punk bands such as The Sex Pistols, The Jam, The Stranglers, Buzzcocks and The Clash really do huddle together in the bottom left half of the chart; they really are the least complex of the lot. On the other end of the spectrum we have theatrical and arty performers such as Kate Bush and Queen.

In real life, there certainly was a clash of attitudes. When The Sex Pistols' Sid Vicious met Queen's front man he's reported to have asked: "Ah, Freddie Mercury, still bringing ballet to the masses are you?" to which Mercury replied "Oh yes, Mr Ferocious, dear, we are doing our best." While we can choose whether or not to believe that Mercury subsequently kicked Vicious out of the dressing room, we can clearly see that, in musical terms, punks and brainy rockers made sure they stayed clear of each other's territory.

Not Just Punk

Some rock bands not normally associated with punk seem to dispute the uncomplicated space of the 'real' punk rock bands: in the figure above, the down-to-earth Status Quo show up in an area quite close to the Buzzcocks. What's more if we rank not only artists with more than 5 hits but all with more than 3, it becomes clear that Status Quo are not the only rockers who have slipped in. Hard rock band Saxon leads the pack.

1. Saxon
2. The Sex Pistols
3. Black Sabbath
4. UK Subs
5. Cockney Rejects
6. Motörhead
7. Generation X
8. The Stranglers
9. The Jam
10. Secret Affair
11. Buzzcocks
12. Status Quo
13. Dave Edmunds
14. The Dickies

... the full list is here.

So while our measures of complexity do have a negative correlation with punk, they also correlate with other music. It seems as if we still have to develop that attitude detector in order to precisely nail down punk music. What we can quite confidently say though is that the second half of the 70s favoured "simple" music, as shown in the figure below.

Among all 15,000 chart tracks, we selected those 20% with the lowest squared sum of our two complexity measures and plotted what percentage of the charts they occupy in each year.

Between 1963 and 1975 the percentage of "simple songs" in the charts doesn't deviate much from around 12%, then there's a dip in 1976, followed by a steep rise. That rise coincides with what can be called the birth of punk: The Sex Pistols' gig at the Lesser Free Trade Hall, Manchester. Only three years later, in 1979, the simplicity trend peaks at over 20%. We can only guess why the proportion then sinks again - does commercial punk not work, maybe? Today's punk purists seem to regard as real punk only stuff that happened before 1979 (punkfm.co.uk writes: "We ONLY play Punk Rock from 1976 to 1979.").

Further on in our series we'll see that punk was not at all a passing fad, as we uncover the re-birth of simple music in the late 80s, on a scale that makes the 70s punk wave seem a mere ripple. Before that we'll dissect the early eighties in next week's instalment: "The Curse of the Drum Machine".

See also

Last week's instalment of the Anatomy of the UK Charts series.

Andy's beautiful images of lyrics by genre.

References and More Info

You can calculate your own Mel-frequency cepstral coefficients with the Vamp plugin software developed at Queen Mary, University of London. A plugin for chroma is available here, or you can read my paper about it. Unfortunately, the complexity measure is not publicly available yet, but we will make an update once it is.

The info on punk history was mainly taken from the Guardian's History of Modern Music. The "Punk Girl" is a Creative Commons-licensed image from Vectorportal.

Data cheat: we did not have data for all singles of The Sex Pistols from 1975 to 1980 and therefore used all their songs (irrespective of chart date).

Lyric clouds, genre maps and distinctive words

Wednesday, 22 June 2011
by andrew
filed under Trends and Data
Comments: 20

One of the interesting things that sets even superficially similiar genres of music apart is their lyrical content. Last.fm tags can overlap to a great degree, but we were interested to see what the words can tell you about the subtler shades of meaning that go along with those tags. As usual around here, the best way to answer questions like these is by asking the data.

So I downloaded the musiXmatch dataset, a collection of lyric tables for nearly 240,000 songs from all around the world (and the musical universe). They are tables in the sense that they don’t contain the intact lyrics of each song, but rather a list of words present in each song, along with the number of times that word occurs. No use for karaoke, but perfect for investigating the overall properties of a genre. I then matched up the songs in the dataset with tracks in our own catalogue, and correlated this with Last.fm tag data, in order to count the number of times a given word appeared in each of several prominent genres.

Lyric clouds

Of course, lists of words and frequencies are a little dry, but thankfully IBM have released a Word-Cloud Generator which can take a weighted list of words and display it graphically, as seen on the Wordle website. The more often a word appears, the bigger it will be rendered. Here’s what it came up with for the genres I tried — the software did the layout, but you can blame me for the font selection.

Click to open full images in a new window.

Warning: they contain lyrics you may find offensive. Not safe for work.

Blues

Country
 

Electronic

Folk

Goth
 

Hip-hop

Indie

Metal
 

Rap

Rock

Soul

I did a bit of pre-processing to remove common ‘stopwords’ that don’t really hold any information about the topics of the lyrics (and, for, I, you, the, plus many more), but this only took into account English words — and if you look closely, you’ll see a few common words from German, French and Spanish (and probably others) that are from foreign-language songs in the dataset. But what’s most striking for me about these is not how much they differ, but in fact how often some of the words appear prominently across genres. Almost everyone sings about love, for example, with the exception of Rap and Hip-Hop, and time comes up… time and time again.

Genre maps

A limitation of word clouds is that while they’re great for showing the comparative popularity of words within a genre, they’re not so good for looking at the overall similarities or differences of several genres at once. To do that, you need some measure of similarity which can be rendered graphically as a kind of ‘genre neighbourhood map’. So I measured the similarities between the word lists for each genre, ranked by popularity, using a method which was developed to compare the result rankings from different search engines. This gives a single value for how similar the lyric choices are between each pair of genres, where differences towards the top of the lists (the most popular words) are considered more important than differences further down. A bit of extra number crunching in R can convert these similarity scores into a 2D map, which I imported into OpenOffice to render:


Click image to open larger version in a new window.

This map is really interesting for its combination of expected and unexpected neighbours, and also for the way it clearly shows Rap and Hip-Hop as outliers from the main axis on the left. Goth and Metal, which may appear similar to the un-trained ear (and eye!), are considerably separated, while Metal and Folk are — surprisingly — much closer. Electronic (a very broad tag) is clustered together with Soul and Blues, presumably because of the soulful origins of house music, which is one of the more lyrical electronic sub-genres. And Rap and Hip-Hop, which might be considered synonymous by the layman, are about as different as Indie and Country in terms of lyric ranking.

Distinctive words

The word clouds as shown draw the viewer’s attention to the very frequent words, but these also tend to be the ones like love and time which are popular across genres. This is a problem if you want to find out which words are most distinctive or characteristic of a given genre — the words which, if used as search terms for example, would be best at selecting songs from that genre correctly (true positives), while minimizing the number of songs retrieved from other genres (false positives). Once again, information retrieval (the science behind search engines) can help us — the F measure or F score is specifically designed for measuring the tradeoff between true positives and false positives in a set of results. It’s a score between 0 and 1, where 0 means “no relevant documents retrieved”, but 1 means “all relevant documents retrieved” and “no additional spurious documents retrieved”.

So I calculated the F score that each word would have as a search term for each genre in some notional lyric-based search engine: “how relevant would the results be if I searched for Indie tracks with the search term friend“ for example. This doesn’t take into account the number of times each word occurs within a song, just the fact that it occurs at all, but it does let us redraw the lyric clouds with each word’s size determined by its F score for that genre. As you can see, this brings out the words that are characteristic of each genre, rather than emphasizing those that are globally popular:

Click to open full images in a new window.

Warning: they contain lyrics you may find offensive. Not safe for work.

Blues

Country
 

Electronic

Folk

Goth
 

Hip-hop

Indie

Metal
 

Rap

Rock

Soul

I think they bring out the unique character of each genre much more effectively, and the variation in size between the words is much less, so the less prominent words are easier to see. There are some interesting quirks visible too. For example, many German words are much more clearly visible in the Goth cloud than they were before, reflecting both the comparatively large number of songs in German in that genre, and the lack of German lyrics in most other genres. Country for example is entirely English.

Finally, a little extra present from the data. The word with the highest F score in the whole dataset is Christmas, with an F score of 0.3892 for the tag… Christmas. So, unseasonal greetings from the data crunchers here at Last.HQ!

Thanks to musiXmatch for making the lyric database available, and Thierry Bertin-Mahieux for helping me to reconstruct the full words from the stems in the database.

Last.fc Take To The Field

Tuesday, 21 June 2011
by Nick Calafato
filed under About Us
Comments: 8

The fine people at Big Scary Monsters kept up with summer tradition by lovingly putting together the 5th annual BSM 5-a-side Football Tournament – a fun-filled day featuring various music and tech folk attempting to prove their muscle on the football pitch.

The tournament provided the perfect opportunity to show what a very green Last.fc can do away from the comfortable confines of our computers and onto the wide open playing field.

As the torrential rain cleared and the sun peered through, spirits prior to our opening game against the burly Disc Manufacturing Services were high:

It was a rocky start as we conceded a few goals early on – despite Lumberjack‘s best attempts at the long range screamers he’d probably been studying on YouTube prior to kick-off:

The game ended Last.fc 4-7 Disc Manufacturing Services. It was a blow – but we were not to be put down too soon as we brushed aside Rosa Valle in our second group game 5-1 with goals from the quick feet of Pbad, the power of eartle, the flamboyance of Daniel1986 and the beard of yours truly. And of course a world class penalty save from the safe hands of Lumberjack – documented on video here.

Our last opponents in the group stage were our friends in Drowned In Sound. All we needed was a draw to qualify for the Last 16, but with our energy levels hitting red we perished to two strong goals and, with no reply, the game ended Last.fc 0-2 Drowned In Sound.

An early exit didn’t stop us enjoying a few post-match bevvies and an all important Last.fc team shot. Rest assured – we will be back next year fitter and stronger than ever!

Top L>R: Lumberjack, eartle, good_bone, darkspark88, y0b1tch

Bottom L>R: nedflanders1979, Daniel1986, Omar711, Pbad

(Congratulations to the Old Blue Last who won the tournament beating Disc Manufacturing Services 3-0 in the final)

Anatomy of the UK Charts. Part 1 - Percussiveness and the Disco Diva

Thursday, 16 June 2011
by
filed under Trends and Data
Comments: 15

Matthias and the MIR team have been hard at work analysing pop music using signal processing algorithms. Over the next few weeks they’re going to reveal some of their findings in a special series: Anatomy of the UK Charts…

Everyone’s their own music expert. Some know more and some know less, but I challenge anyone to have listened to the entire catalogue of the UK charts. It stops being fun after a while. That’s why at Last.fm we’ve programmed our computers to listen to music.

We fed them around 15,000 tracks from the UK singles charts between 1960 and 2008 and discovered some fascinating results we’d like to share with you. It all starts with the discovery that just before the middle of the 70s something in the data changed…

The Explosion of Percussiveness

The explosion of percussiveness is one of the most distinctive patterns we have observed in our audio data. In the figure below we’ve plotted the proportion of “percussive” tracks in the UK charts over time. In order to decide how percussive a track is, we use our audio analysis framework to read the MP3 file and create a series of graphs known as spectrograms. In a spectrogram, vertical patterns indicate percussive elements, and the strength of these patterns, averaged over a whole track, is a good measure of its percussiveness.

What you see in the figure are the top 20% percussive tracks of all 15,000 tracks, and how much of the charts in a particular year they occupy.


 Donna Summer – Love to Love You Baby
 KC And The Sunshine Band – Sound Your Funky Horn

We were surprised to find such a huge leap around 1974 – so what happened to make the charts go percussive?

The simple answer: Disco. In the figure above, we’ve marked two songs that were in the first wave of successful Disco tracks in the UK, “Blow Your Funky Horn” by KC And the Sunshine Band (topping at number 17 in December 1974) and Donna Summer’s ground-breaking erotic Disco song “Love To Love You Baby” (number 4, February 1976). In fact, if we look at all the percussive tracks from 1974 to 1979, Donna Summer is the leading artist:

Artists with highest number of “percussive” hits (1974-1979):
7 – Donna Summer. Example:  Hot Stuff
5 – Hot Chocolate. Example:  You Sexy Thing
4 – Eric Clapton. Example:  I Shot The Sheriff
4 – KC and the Sunshine Band. Example:  I’m Your Boogie Man
4 – Tina Charles. Example:  Love Me Like A Lover
3 – Barry Biggs. Example:  Work All Day
3 – Bob Marley & the Wailers. Example:  Could You Be Loved
3 – Earth, Wind and Fire. Example:  Let Me Talk
3 – Rose Royce. Example:  It Makes You Feel Like Dancin’

Now there’s not only Disco in those tracks but also some reggae, not least because Eric Clapton went reggae. We’ll have to look beyond percussiveness in order to find out more about Disco.

Donna the Disco Diva

So can we find out what’s really Disco? For the sake of the argument, let’s say that Disco is 70s music that’s percussive and has a steady rhythm. As it happens we have a measure for “steady rhythm”, calculated using our new measure of rhythmic change (see Audio Flowers). We calculate it this way: “rhythm steadiness” = 1 – “rhythmic change”.

In the figure below, we have plotted the values of percussiveness against this “rhythm steadiness”. This time it’s not about individual songs, but about artists. The position of each circle shows the average percussiveness and steadiness of all the artists’ tracks (1974-1979), while the sizes of the circles indicate how many hits they had. We’ve added artist names for those who had more than 8 hits.

One does get a feeling that Donna Summer is somehow special. Among all artists with more than 8 hits, her tracks are by far the most percussive and rhythmically steady… she’s so Disco! ABBA have a softer touch of Disco, much less percussive, but often quite steady, whereas Elton John is revealed as seriously non-disco – despite his (rather late) 1979 attempt to cash in on the craze with Victim of Love.

But Elton and co had already had their share of the cake – there’s so much more to the 70s than Disco! Check back next week for “Clash of Attitudes” (edit: find it here), the second part of our Anatomy of the UK Charts.

Further Reading

Charts: the official UK charts; the independently-maintained Chart Stats.
Music Information Retrieval: technical paper on audio analysis of rhythm; Last.fm’s Audio Flowers (for rhythm steadiness/change); general introduction to content-based Music Information Retrieval.

If it doesn't Scrabble, it doesnt count.

Tuesday, 14 June 2011
by Matthew
filed under Stuff Other People Made and About Us
Comments: 11

I’m in the lab all day, I Scrabble all night
I got a Bedazzler so my outfit’s tight
When it comes to panache I can’t be beat
I got the most style from below 14th street”

- Beastie Boys, “Shazam!”

About a month ago a press release appeared on the HarperCollins website noting that some new terms “from the digital world” were going to be added to the official Scrabble dictionary. Those words included: wiki, fansite, webzine, darknet, and best of all… scrobble.

Not being a habitual reader of lexicographical press releases, I missed this at Last.fm HQ until Dan in our sales team mentioned it in a note he was sending out to some people we work with. This little factoid got me more excited than when Matt, our data griot, decided to livetweet his first listen to the recent Lady Gaga album. You see, it is my firm belief that Scrabble and the music tech world have a lot in common. Hear me out.

Scrabble, like a lot of music, has an annoyingly complicated copyright history: Hasbro owns the rights to the game in the US and Canada, Mattel owns the rights in the rest of the world, and Electronic Arts own the rights to digital versions. It’s amazing you don’t need to be a lawyer to play the game.

Which explains what happened in 2008 when a pair of brothers created an online version of Scrabble (Scrabulous) that worked really well on Facebook. More than half a million new fans of the game were born, but the first response from Scrabble’s corporate masters was to shut it down and sue the pants off the two brothers who made it, rather than figure out how to work with them to bring the game to more people. Which is pretty much how the music industry has worked for the last decade.

But it’s not just lawsuits that Scrabble and music have in common:

- Stephen Malkmus and the guys from Pavement were well known for their Scrabble games on tour. Courtney Love was famous for wanting to play against Stephen and he was equally famous for beating her in tile-to-tile combat.

- Elvis Costello likes to call himself the “rock and roll Scrabble champion.” And this Etsy shop will sell you a Scrabble tile pendant with Declan MacManus’s face on it so you can show your allegiance.

- The Beastie Boys are Scrabble junkies, and Ad-Rock even goes looking for competition on the road, dropping in at local Scrabble club events.

- There are dozens of songs with Scrabble in their titles on Last.fm, including an excellent one about a Scrabble date gone bad from Milky Wimpshake.

The only bad thing about ‘scrobble’ making it into Scrabble is that it’s pretty tough to pull off in a real game; it’s eight letters and you’ll need the only two Bs in the bag. But it’s worth it. ‘Scrobble’ has three 3-point letters in it and it’s worth 14 points on its own… much more if you can hit a multiple-word-score or squeeze it in to an existing cluster.

Our motto is the same in Scrabble as it is for music: Make every play count.


Scrabble cat, a sometimes visitor to Last.fm HQ

Berlin Buzzwords 2011

Monday, 13 June 2011
by
filed under About Us
Comments: 5

Last week, Gilda Maurice (from our data team), Steve Whilton (from our product team) and myself went to Berlin for a couple of days. While Steve hurtled round Berlin from meeting to meeting — rather him than me — Gilda and I headed over to the Berlin Buzzwords conference at the Urania conference centre, just south of the famous Tiergarten.

It’s an annual meetup for engineers, scientists and other assorted hackers in the field of ‘big data’. The problems of processing and analysing the amount of data generated on the social web have required a whole new set of approaches, and we’re very keen on keeping up with new developments in this area, especially if they can help us make Last.fm better.

Two of the main open-source data tools we rely on at Last.HQ are Hadoop, a framework for parallel storage and querying of data on a cluster of servers, and Solr, a search engine based on the Lucene toolkit. Solr drives the search functions on the web site, and Hadoop does much of the behind-the-scenes number crunching, such as generating the weekly charts and calculating artist similarities. Lucene and Hadoop have both been very influential in this field, so it was fitting that the conference opened with a keynote from Doug Cutting who originated both projects.

In fact, Doug Cutting’s intro set the tone pretty well — probably half the talks were on Lucene or Hadoop, or other technologies that build on them. We learnt how to tune Solr performance and measure its relevance, how to improve its accuracy with a dash of linguistics, and how to visualize the topics within a given set of search results. Facebook and StumbleUpon presented their experiences of HBase, a Hadoop-backed database for storing and querying massive quantities of user data and content in real time, and JTeam took us through Mahout, a machine-learning toolkit for clustering and classification tasks, also based on Hadoop. A few of the talks went further into computer science theory, but always with a view to producing high-volume applications ready for web-scale data.

It’s hard to pick favourites out of such a dense line-up, but we particularly liked Joseph Turian‘s talk on new data-mining techniques (semantic hashing, graph parallelism and unsupervised semantic parsing), and Stanislaw Osinski‘s session on clustering and visualizing Solr search results with Carrot2, accompanied by a beautiful demo. Mark Miller and Rod Cope gave some sound advice on scaling Solr and HBase, and Chris Wensel took us through designing algorithms to manipulate and extracting data from Hadoop.

Sadly there was no way we could catch all the talks we wanted to see, with three rooms running in parallel each day, but thankfully all the talks were filmed — the slides are available here (apart from a few which are yet to appear), and the organisers will be making all the videos available soon.


Steve and Andy on a Berlin rooftop. Photo by Gilda.

Music Hack Day Berlin

Friday, 3 June 2011
by michaelc
filed under Code and Stuff Other People Made
Comments: 5

Last weekend, Russ Hall and I travelled to Berlin for the latest in the series of Music Hack Day events. Having been to previous ones in Stockholm and London, I was looking forward to the usual mix of creativity and collaboration that these events are famous for.

For those that don’t know, Music Hack Day is a chance for programmers, designers, artists, etc, to get together and create new and exciting music hacks based on the latest APIs from top music tech companies (or they can just use a soldering iron and some knitting needles). It’s always amazing to see what a room full of talented people can come up with in just 24 hours and this one was no different.

APIs

First up at a Music Hack Day are the API presentations. This is where music tech companies pitch their APIs and it’s also an opportunity to announce new features for devs to get stuck into straight away. We were there to present our API and the addition of our beta realtime API.

Hacking

After this, everyone fuelled up on Club-Mate and set about hacking. I played with a few side projects while Russ joined up with Tim Bormans of Soundcloud and Jens Nikolaus (designer of the much sought after Music Hack Day Berlin tote bag with Kristina Schneider) to create Sleev.in, an album obsession sharing site.

Here’s Tim and Russ mid-hack.

The amount of sleep you get over the Saturday night depends on how well your hack goes and/or how ambitious you were and at around 2pm on the Sunday, around 24 hours after you’d have started, it’s time to put down your laptop and present what you’ve done.

Hack demos

The hack demos are always fun to attend and see what everyone else has been making.

Some notable Last.fm related hacks were Lastcred.fm which would, to make your Last.fm profile look trendier, scrobble several random tracks for you based on a tag or artist of your choice (not something we really approve of, but it amused us nonetheless), Tractor which pulled in Last.fm data to help with displaying artist info for mentions of an artist on a web page, and RealTimeSentiTweetGagasm which used our realtime API.

Other favourites of mine were Heavy Shoes which used an Xbox Kinect sensor to detect foot stomps and then play drum noises (something I want to be doing at home very soon), and Eigendrums which also triggered drum sounds, but this time by detecting the sound of you clicking, slapping your leg, and thumping your chest. Both crowd pleasing impressive demos.

You can find the complete list of hacks here.

If any of this interested you then why not think about attending a Music Hack Day! The next one is in Barcelona in a few weeks, but they crop up fairly regularly.

And finally a big thanks to Roel van der Ven and Johan Uhle of Soundcloud for organising such a fantastic event.

Don't mix networks and exhaust fumes

Wednesday, 25 May 2011
by mike
filed under Announcements
Comments: 13

Last.fm is all about bringing you music you love, and a big part of that is the technical infrastructure required to make it all happen. We take site and service reliability very seriously, which is why we get upset when things go wrong.

And this week things went wrong. It has been a particularly busy one for us, as we’ve had to deal with a large router failing on us which has unfortunately had user visible impact in a few places. As such, we want to share some of the back story, so you can understand what happened and how we’re working on making things better.

What the Ops team do

Last.fm began life as a small start-up some years ago now, and as is normal for technology based start-ups, reliability at a large scale wasn’t a big concern at the beginning. Start-ups focus on making things work, and worries about uptime and reliability come later. Reliability also costs money, and adds complexity to systems – it’s easy to inadvertently make a “highly-available” configuration less reliable than a single server. We do a lot today to deliver service reliability that wasn’t part of our earlier architectures, and we can survive many problems with no externally visible signs.

Today, we run Last.fm from multiple separate datacentres, and we build resiliency and failover into all our new systems from the outset. We’re working hard on retrofitting this same level of reliability to all our older systems, though we still have some way to go before everything is where we’d like it to be.

The biggest problem we engineer for is the complete failure of an entire site. That’s a level of problem that we don’t expect to happen often, but we do plan for it and there are many aspects that need to be considered. It’s also the problem we effectively encountered this week, and for the most part everything went according to plan.

What happened

The system that failed was a large core router, which provides our cross site connectivity, and half of our internet connectivity. Its failure effectively isolated all the equipment in that datacentre, and caused us a lot of trouble. The system in question is equipped with fully redundant supervisor modules to prevent this sort of problem, but – for reasons that did not become apparent until later – the redundancy also failed.

We initially saw problems with this system a week ago, and carried out both a component swap out and reload of the software, which we thought had resolved the problem. When it failed again, our hardware service partners concluded we must be looking at a backplane fault, and shipped us a new chassis.

The backplane in this sort of system is essentially just a passive circuit board, so faults of this kind are most unusual. It wasn’t until we removed the old chassis that we discovered a large amount of grime covering its intake vents, which is not what you expect in a data centre with large air filtration and cooling systems.

It turns out that some of the air intake for this hosting facility is pulled in fresh off the roof, and the adjacent building houses the exhaust stack from the diesel generators used as back up power. In a suitably ironic fashion, the diesel exhaust was being pulled into the air conditioning system, depositing fine particulates on surfaces, including our hardware.

Where you have equipment with large fan assemblies, this problem is made worse, and the deposits can cause electrical problems, leading otherwise highly reliable equipment to mysteriously fail. The datacentre we use has only recently become aware of this problem, and is taking steps to resolve it, but in the meantime we’ve had to deal with the effects.

What problems did users see?

During these problems, users may have seen a couple of issues. The first and most visible of these will have been radio failures. Our radio infrastructure is cross site, but currently needs a careful manual failover process of some elements, so you may have been without radio for a period of time. Web site traffic and API traffic fails over automatically, so most people won’t have seen any issues with this. Some users will have though, as the cross site failover process is DNS based – this means it’s not instant, and ISPs that don’t correctly handle DNS timeouts can cause extended problems. This kind of thing seems to be most common amongst mobile providers.

Some of you will be concerned about your scrobbles – no scrobbles were lost during these issues. Client caching should ensure that any that didn’t make it to our servers will have been queued and resubmitted.

We’re sorry for any problems you may have seen while we worked on this behind the scenes. We’re constantly working on making the service better, and making these incidents a thing of the past. Thanks for listening!