
As promised last week our resident Research Fellow Matthias has been hard at work data-mining our music recordings for this new instalment of our Anatomy of the UK Charts series...
Not everyone is into dancing. As I showed you in last week's post our audio analysis algorithms can trace the rise of disco after 1974, but around that same time a colourful range of other new styles emerged, including hard rock, glam and art rock... and then there was that other genre: punk, the attitude-laden antidote to "established" music.
While we haven't actually come up with a measure of attitude in music, the fact that punk was the anti-establishment, non-musician's music made it relatively easy to track down...
The Democratisaton of Making Music
"This is a chord. This is another. This is a third. Now form a band."
According to the Guardian's History of Modern Music these legendary instructions were first printed in the punk zine "Sideburns" in 1977. They are famous because they summarise the anyone-can-play attitude of early punk - the democratisation of making music. Well, if there's any truth in that, looking for harmonically simple music without fancy changes in sound colour should get us straight to punk. Will it?
We have a variety of signal processing algorithms that take an MP3 file, extract musical features from it, and then measure how much these features change over different time scales, from note to note, chord to chord, phrase to phrase or even between sections of a song. Looking at these rates of change can give us a good measure of musical complexity.
To see how complex the harmony of a song is, for example, we first extract "chroma" features. Chroma describes which notes are sounding at any time in the song. Then we look at how much the chroma changes over a time scale of around 3 seconds, which is the length that a chord is typically sustained. Using this method, lots of chord changes will lead to a high value for harmonic complexity.
Likewise for sound colour, usually called "timbre" in scientific circles, we start by computing a particular spectral feature that is heavily used in speech recognition: Mel-frequency cepstral coefficients (MFCCs). The rate of change of these MFCCs at a time scale of about a second should get us a measure of timbral complexity. If the instructions from the zine are accurate then punk shouldn't have much harmonic or timbral complexity.
In the figure below we have plotted timbre complexity against harmonic complexity. The grey dots show the positions of all songs in our charts database from 1975 to 1980, and we have overlayed some colourful stars, each representing an artist with more than 5 hits. We selected the six least and the six most "complex" artists as ranked by the sum of the squares of our two complexity measures. The centre-point of each star is the median average of the artist's songs. You can select your favourite combination of artists from the list below. The play buttons start playback of the track that's "most typical" of the corresponding artist, i.e. that which is closest to the centre of the star.
We find it fascinating that - as we would expect - all the famous punk bands such as The Sex Pistols, The Jam, The Stranglers, Buzzcocks and The Clash really do huddle together in the bottom left half of the chart; they really are the least complex of the lot. On the other end of the spectrum we have theatrical and arty performers such as Kate Bush and Queen.
In real life, there certainly was a clash of attitudes. When The Sex Pistols' Sid Vicious met Queen's front man he's reported to have asked: "Ah, Freddie Mercury, still bringing ballet to the masses are you?" to which Mercury replied "Oh yes, Mr Ferocious, dear, we are doing our best." While we can choose whether or not to believe that Mercury subsequently kicked Vicious out of the dressing room, we can clearly see that, in musical terms, punks and brainy rockers made sure they stayed clear of each other's territory.
Not Just Punk
Some rock bands not normally associated with punk seem to dispute the uncomplicated space of the 'real' punk rock bands: in the figure above, the down-to-earth Status Quo show up in an area quite close to the Buzzcocks. What's more if we rank not only artists with more than 5 hits but all with more than 3, it becomes clear that Status Quo are not the only rockers who have slipped in. Hard rock band Saxon leads the pack.
2. The Sex Pistols
3. Black Sabbath
4. UK Subs
5. Cockney Rejects
6. Motörhead
7. Generation X
9. The Jam
10. Secret Affair
11. Buzzcocks
12. Status Quo
13. Dave Edmunds
14. The Dickies
... the full list is here.
So while our measures of complexity do have a negative correlation with punk, they also correlate with other music. It seems as if we still have to develop that attitude detector in order to precisely nail down punk music. What we can quite confidently say though is that the second half of the 70s favoured "simple" music, as shown in the figure below.
Among all 15,000 chart tracks, we selected those 20% with the lowest squared sum of our two complexity measures and plotted what percentage of the charts they occupy in each year.
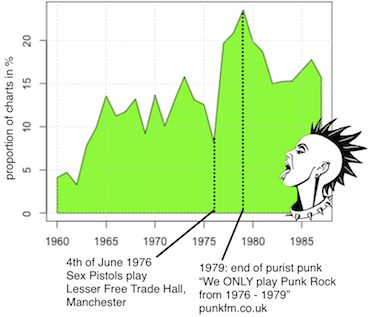
Between 1963 and 1975 the percentage of "simple songs" in the charts doesn't deviate much from around 12%, then there's a dip in 1976, followed by a steep rise. That rise coincides with what can be called the birth of punk: The Sex Pistols' gig at the Lesser Free Trade Hall, Manchester. Only three years later, in 1979, the simplicity trend peaks at over 20%. We can only guess why the proportion then sinks again - does commercial punk not work, maybe? Today's punk purists seem to regard as real punk only stuff that happened before 1979 (punkfm.co.uk writes: "We ONLY play Punk Rock from 1976 to 1979.").
Further on in our series we'll see that punk was not at all a passing fad, as we uncover the re-birth of simple music in the late 80s, on a scale that makes the 70s punk wave seem a mere ripple. Before that we'll dissect the early eighties in next week's instalment: "The Curse of the Drum Machine".
See also
Last week's instalment of the Anatomy of the UK Charts series.
Andy's beautiful images of lyrics by genre.
References and More Info
You can calculate your own Mel-frequency cepstral coefficients with the Vamp plugin software developed at Queen Mary, University of London. A plugin for chroma is available here, or you can read my paper about it. Unfortunately, the complexity measure is not publicly available yet, but we will make an update once it is.
The info on punk history was mainly taken from the Guardian's History of Modern Music. The "Punk Girl" is a Creative Commons-licensed image from Vectorportal.
Data cheat: we did not have data for all singles of The Sex Pistols from 1975 to 1980 and therefore used all their songs (irrespective of chart date).
Comments
dave
23 June, 13:40
Elkie Brooks along with Gladys Knight are the only singers listed here that can really sing.
HodgeStar
23 June, 16:54
I see the same steep ramp in the beginning of the 60s. How do you discuss that away? Who were the punks back then? Stones or Beatles? Clashing with Elvis and James Brown? Some say that acid house IS punk! That’s not a curse. And where is emo in your scheme?
Anyway, to be honest, why are you doing this? You have so much data on your own servers but you are looking at external sources (the historic UK charts of all charts) with statistical analyzers which actually belong to the echonest. Why?
If it sounds like i would like to bash a “research fellow hard at work data-mining music recordings” as you say it, that’s not my intention but last.fm is attitude-laden too and i tell you the minute you apply such algorithms to programm your radio you’ll disestablish yourself…
…nice graphs, though. thanks!
Matthias Mauch
23 June, 18:04
Hey HodgeStar,
I like observation about the steep rise of our feature in the early 60s. I haven’t been able to look into that much yet, and to be honest, if I did, results might be less meaningful because our data for that era is less complete. Also: I appreciate your comments on emo and acid house, will be useful to have a closer look at those when I do a post on the late 80s.
Now one thing you might have got wrong a bit is where our audio technology comes from: the greatest part of the features we use have actually been developed over the past years in-house at Last.fm, and some were adapted from the open sources we cite in the blog post. The Echonest have surely been quite good at publicising their own service, but they are not the only ones doing audio features and we certainly haven’t used theirs.
And yeah, the curse… well, I quite agree with you on that, the drum machine hasn’t really been a curse at all, as I’m sure you’ll find out in next week’s post.
HodgeStar
24 June, 09:55
Thanks, Matthias! I was about to write a long response but i better leave it.
Scientists should do what comes to their minds, that’s what they are good at. Go ahead! To not make use of the work of Echonest or Musicbrainz isn’t logical, though, more a political stance like Firefox’s refusal to support MP3. I digress….
…you developed a feature. Great! Why not use it to find out the connexions – rockers, punk, skinhead, mod, ska – what sets them apart is not the music. That’s my believe. I can’t prove it, though. So thanks for your analysis. It makes sense and i liked to read it.
IanAR
24 June, 12:07
Very interesting & quite meaningful, I think – Thanks!
Like HodgeStar – I too, think it’s artificial to surmise: Between 1963 and 1975 the percentage of “simple songs” in the charts doesn’t deviate much from around 12% – as a 1963 is obviously in the middle of some huge change, in the terms of the analysis. This seem somewhat concordant with the Beat period but I don’t know it well enough to explain the dramatic end of that ramp, 1964-5 – unless British Invasion / Beatlemania were sufficiently distinct, in terms of these complexities, to explain.
Again, it would be nice to have public access to harmonic / timbre complexity figures found, for those tracks.
I hope a future analysis will attempt to illustrate the decline / reversal of racism – the rise of MoBO – inherent within these figures.
audiocruncher
25 June, 19:35
“To not make use of the work of Echonest or Musicbrainz isn’t logical, though, more a political stance like Firefox’s refusal to support MP3. I digress….”
I disagree with you. What is logical is to use the most accurate and practical analysis tool at hand ; and the EN solution fails on both criteria. I am not speaking for the author of this blog post, but I am confident that some of the 3 points I’ll put forward explain his choice of tool – more than any NIH syndrome or political stance.
1/ From what I have evaluated of it, the Echonest audio analysis API is less accurate and provides a less complete description than some other audio analysis projects from the academia (Marsyas, Aubio, Yaafe, Sonic Annotator/VAMP). Their chroma features are noisy (compared to the clean data you get out of Matthias’ NNLS chroma front-end), their beat tracker is not stellar, and they have never gone beyond segment-level timbre+chroma (chords? melodic line detection? rhythmic features?).
2/ Running a job taking 3s per track on a cluster is way easier and faster than uploading or looking up tracks with a throttled web API.
3/ Finally, I don’t think it’s a good research practice to rely on some superficially described black-box in the cloud rather than on something extensively documented by research papers and/or source code that you can get your hands dirty on. Especially when the black box doesn’t seem to do anything better than the more transparent options.
HodgeStar
25 June, 23:55
Hi audiocruncher, point two is wrong but you’re right that, for a onetime project, you choose the best tools at hand. If you’ve devolped your own the better. The thing is that at the outside of these two blackboxes Lfm and EN pretend to be good friends and that it’s all about scientific research to make the world a better place. So one could assume that for insiders, especially those who work there, the inside of these blackboxes isn’t that black.
EN put quite some technological effort into an infrastructure to publish audio meta feature data to the public. Lfm put quite some technological effort into an infrastructure to publish music catalogue listening behavior data to the public. In both cases the data is noisy. Lfm’s data accuracy sucks at least as badly as EN’s if you say EN isn’t good enough. The nature and the approach to music is completly different, though. Lfm did a u-turn last year with the official explanation that they want to focus on their core competencies now – others were oh so much better in the fields they’ve left. What is Lfm’s core competency? It is, lo and behold, scrobbling!
As i said, earlier Matthias’ audio analyses are very interesting to read. They haven’t revealed anything groundbreaking new about music history yet but they demonstrate impressively that it is possible to read history directly from the waveform. The question is, what comes next? The electric monk who says: “If it doesn’t scrobble, it doesn’t matter, we have these machines here listening for you”? That was my initial question when i asked why. Will that what has been “developed over the past years in-house at Last.fm” find it’s way, in one form or the other, into how the site works on the big scale? When it happens i want to at least know it. i don’t want to be analyzed without knowing, you know ;)
Caesar Tjalbo
4 July, 14:20
For some of those bands, the period seems too restricting, The Stranglers are the most obvious example. Another point is the limitation to singles, especially for an era when the LP still reigned supreme. Compare the test results for Black Sabbaths singles with an entire album and I guess there’s a considerable greater amount of complexity.
Matthias Mauch
13 July, 17:08
Hi Caesar,
Nice comments. Yes, The Stranglers have been very active for much longer. I had to make a stop somewhere, but I see your point.
The album thing also tricky. It really depends on what you’re after: if you want to find out things about an album-based band, then the singles that we use here are clearly not enough – I couldn’t do Black Sabbath (and many others) justice.
For a more general “historic overview” on the other hand, albums would bias the data quite a bit because they contain many songs only few people ever listen to.
We went for the latter approach for now, but we’re aware of the drawbacks and we’ll keep them in mind.
Comments are closed for this entry.